The End of Belgian Heatmapping
Dramatic clickbait title: ✓. Anyway, since I was writing things up yesterday, I figured I would continue while I still felt in the mood for more. Life has changed a bit for me: I moved across the Atlantic half a year ago. That means my active heatmapping in Belgium has come to an end for the time being. I liked expanding my Brussels domination and my silly weekend heatmap trips, but having them require a transatlantic flight is a bridge too far for me too.
In this post an overview of what I had been up to in Belgium prior to leaving.
Out With Cities, In With Hexagons
After finishing Brussels, I had a bit of an issue. The cities near me stretched out awkwardly away from Brussels.
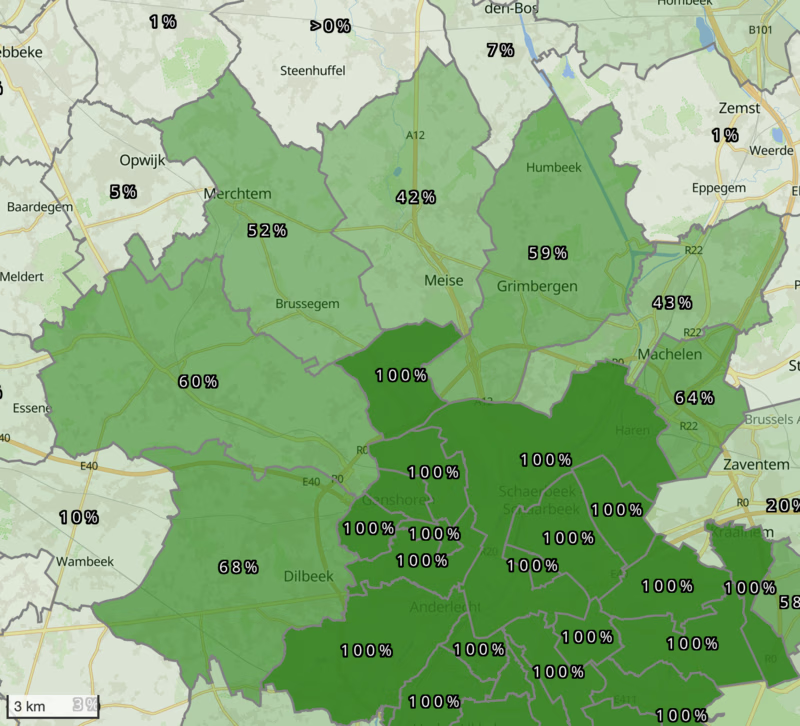
I was not motivated to focus on just one of those cities, getting to their far side was just not a simple task. What I really wanted to do was chip away at streets nearest to me while still feeling (and seeing!) progress. Of course I can just look for the nearest streets, complete those, carry on, but it was not as visually appealing a way for me to go about it.
In came the H3 hexagons (announcement blog post). The idea with these is to cover the globe in hexagons and a few pentagons to make it all fit nicely (technically the term seems to be “geospatial index”). There are several “resolutions” of these covers: the higher the resolution, the smaller each hexagon is. For every position on earth, it is deterministic to which hexagon at which resolution that spot belongs.
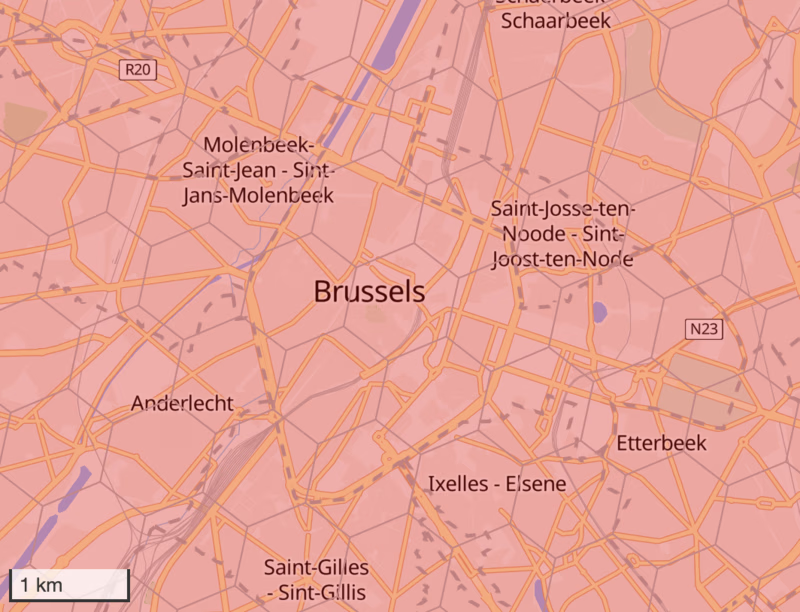
What does it mean in practice? I picked a resolution (eight) that I felt made sense to me in terms of the size of each hexagon. In Brussels, that resolution makes each hexagon about 0.6 km² (the next resolution up or down makes this about seven times smaller or larger). I used that resolution to cover my entire area.
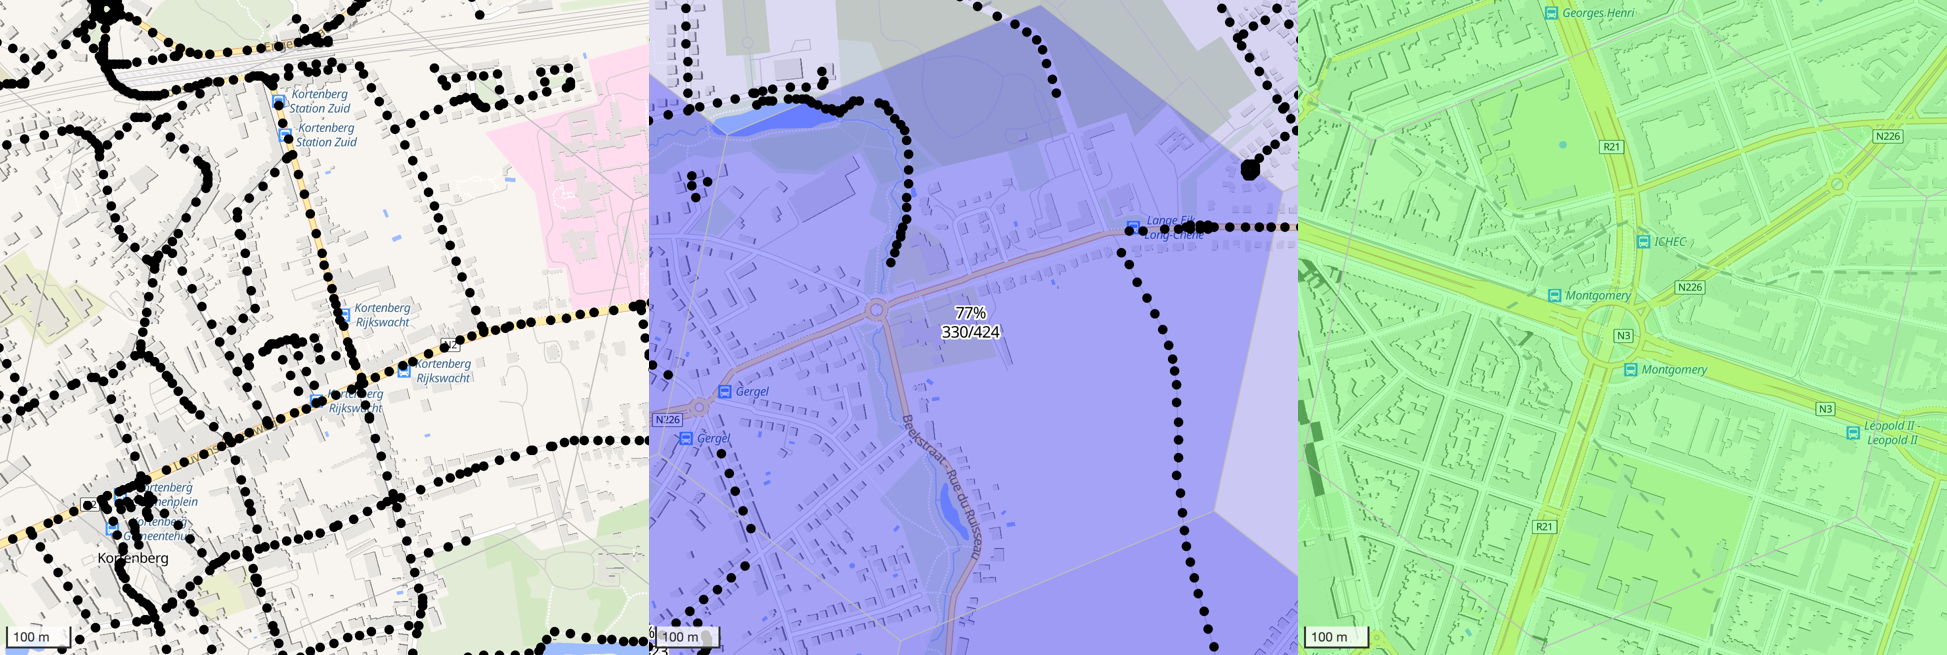
For each hexagon, I want to calculate how much of it I have completed. There
are a few ways to go about this. My approach ended up taking streets from
OpenStreetMap and breaking them up in the nodes that compose them (in more GIS
terms: LineStrings and their Points). Next, it adds nodes in-between if two
nodes of a street are too far apart. So a *-------* becomes *-*-*-*-*. For
completion calculation, the approach then forgets about those streets and puts
every node in its corresponding hexagon. If I have “run a node”, i.e., a GPS
reading came close enough to the node, then the node is marked completed.
Finally, a hexagon’s completion is the percentage of its nodes that are
completed.
Now, I had already completed Brussels, but I still wanted some extra work within the city. So, eventually, I have went from considering just streets with a name, to also including footpaths and cycleways with a name, to (after my move away from Brussels) also including anything that is part of a hiking or cycling route (think a GR or E route, or the ACT).
The final result for the greater Brussels area? Well, I cannot show you what it looked like when I left, which was also prior to adding hiking and cycling routes, but I can show you the current state of the map. OK I could figure out a way to show you the state at that point, but I am not willing to make that effort.
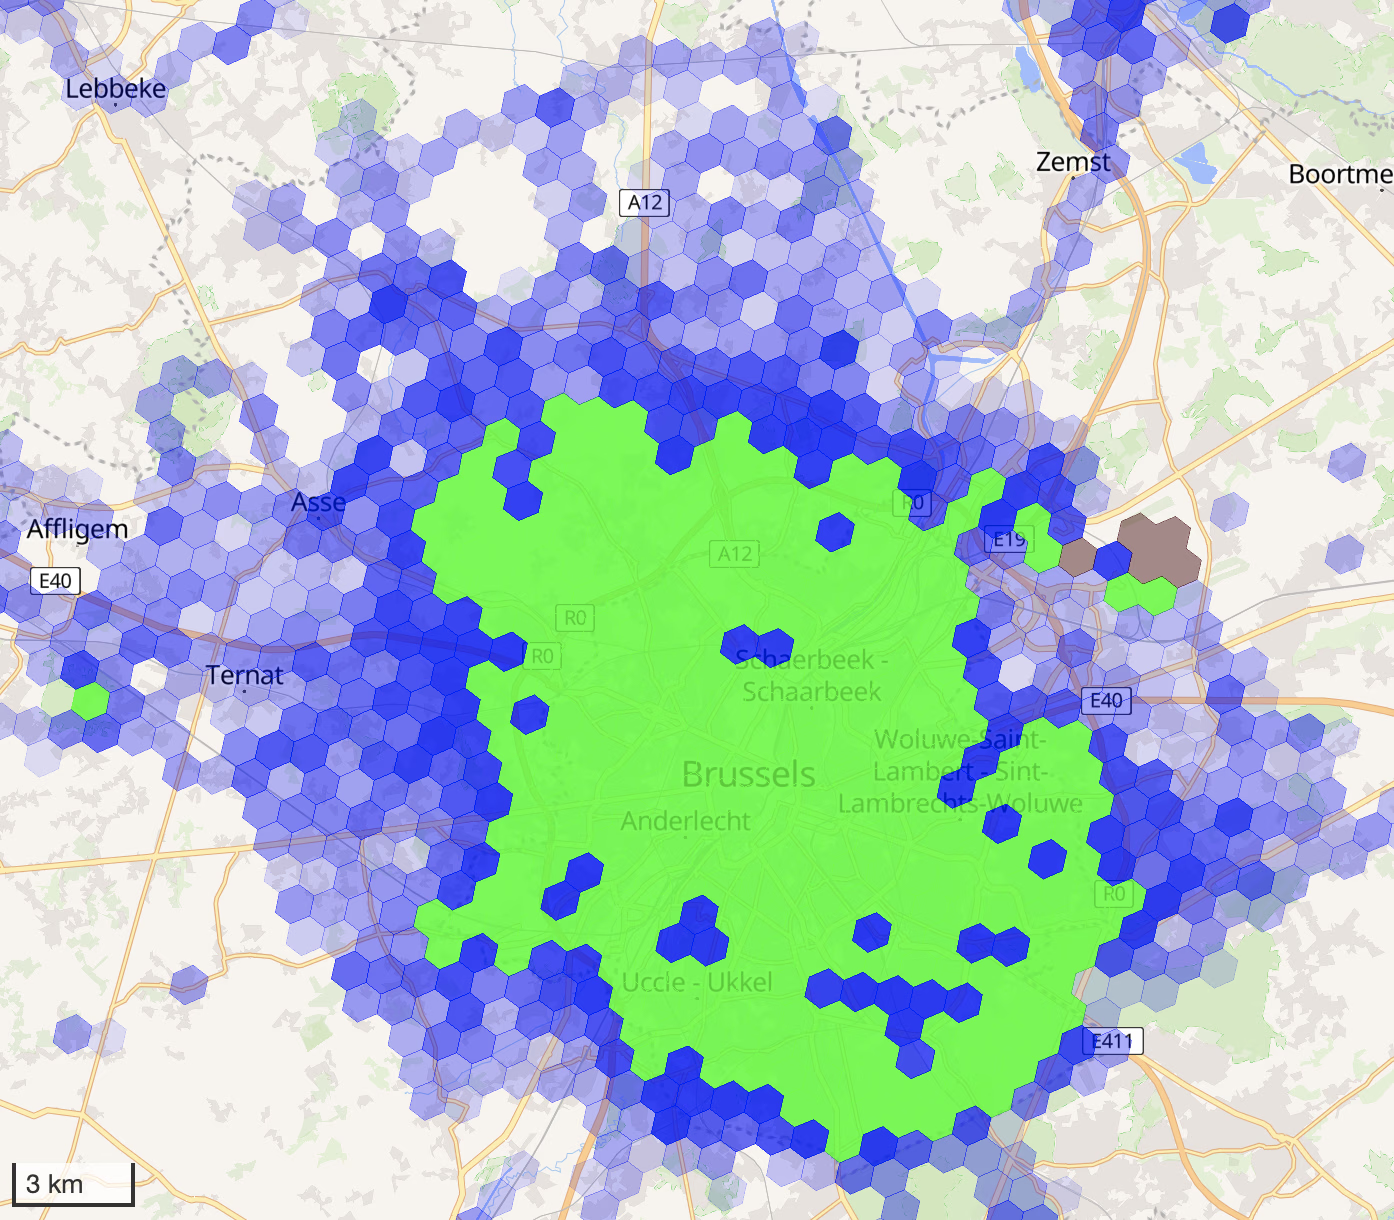
I have grown quite fond of this visualisation. There is a sense of achievement for completing a hexagon. You see your green wall growing. You can figure out the sort-of nearest incomplete hexagon easily. You can combine hexagons into a larger sort-of hexagon that you can embiggen. I even like making my wall of only in-progress hexagons larger, meaning I have run or walked through the hexagon at some point. Since actively using this visualisation, I noticed I have paid way less attention to actual city progress.
Tricountry Points
On the last update, I had one final tricountry point to connect my heatmap to: the border between Belgium, Luxemburg, and Germany. Spoiler alert: I connected that too.
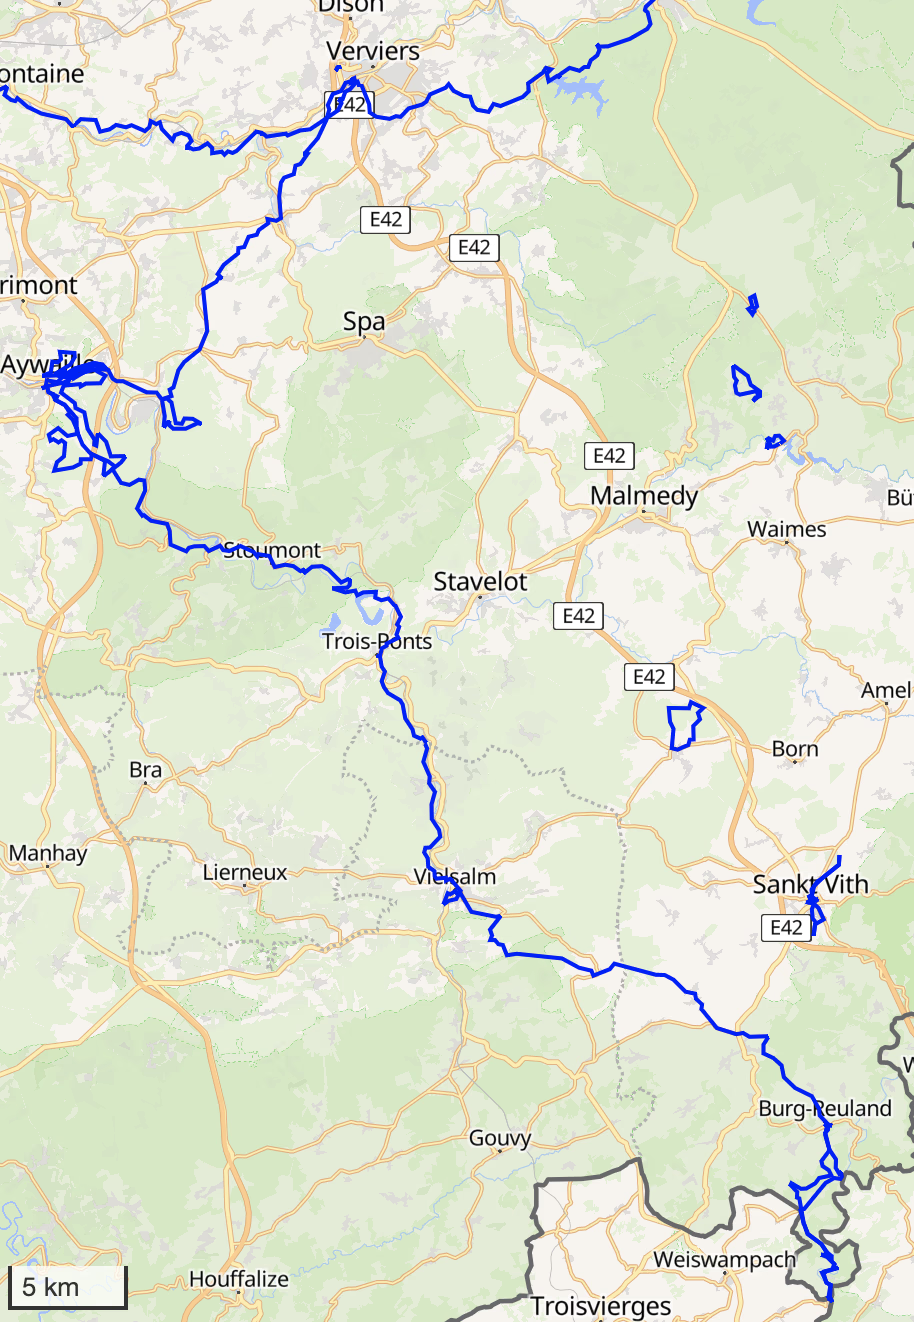
In September 2023, a friend told me I should use his car for a weekend trip. I decided to take the car to go do some walking in the German-speaking parts of Belgium, as these are not as accessible by public transport. While there, I also ended up passing by the tricountry point and connecting that up to the village of Burg-Reuland. I had not planned this out particularly, but decided on it while I was passing by anyway. Then I ignored the tricountry point idea again for half a year.
By March 2024, I knew the clock was ticking on my move. I also knew that once out of the country, I was unlikely to ever complete this last connection. Thus motivated, I worked out the path I might take.
That March, I connected Aywaille to Verviers. I had already spent a weekend in Aywaille once and wanted to connect my runs and walks there to the rest of my heatmap blob. In April, I went to Aywaille again and connected it to Coo, just north of Trois-Ponts on the map above. Coo is famous (in Belgium) for its waterfall, some thinking it is the tallest in Belgium. Coincidentally, I had, by accident, walked by the actual tallest, but very unknown, waterfall in Belgium during my little trip in the German-speaking part back in September 2023. In May, I connected Coo down to Vielsalm.
That left the connection I had been dreading. For the previous connections from Verviers down to Vielsalm, I always went from train station to train station. Easy enough, comfortable, pretty fast. Burg-Reuland, however, does not have a train connection. Instead I had to take the train to Verviers, followed by a bus going all the way down. It is lucky that at this point I was committed to finishing things up. That May 2024, I made the trek down to Burg-Reuland, ran back up to Vielsalm, and completed my spiderweb connection of tricountry points.
The End
I moved out of Belgium back in June 2024 and evidently will still be passing by my friends and family there somewhat often. Doing any special running and walking adventures, however, will not be high on my agenda while there.
As such, my current heatmap of Belgium will remain stable for some time. Here it is.
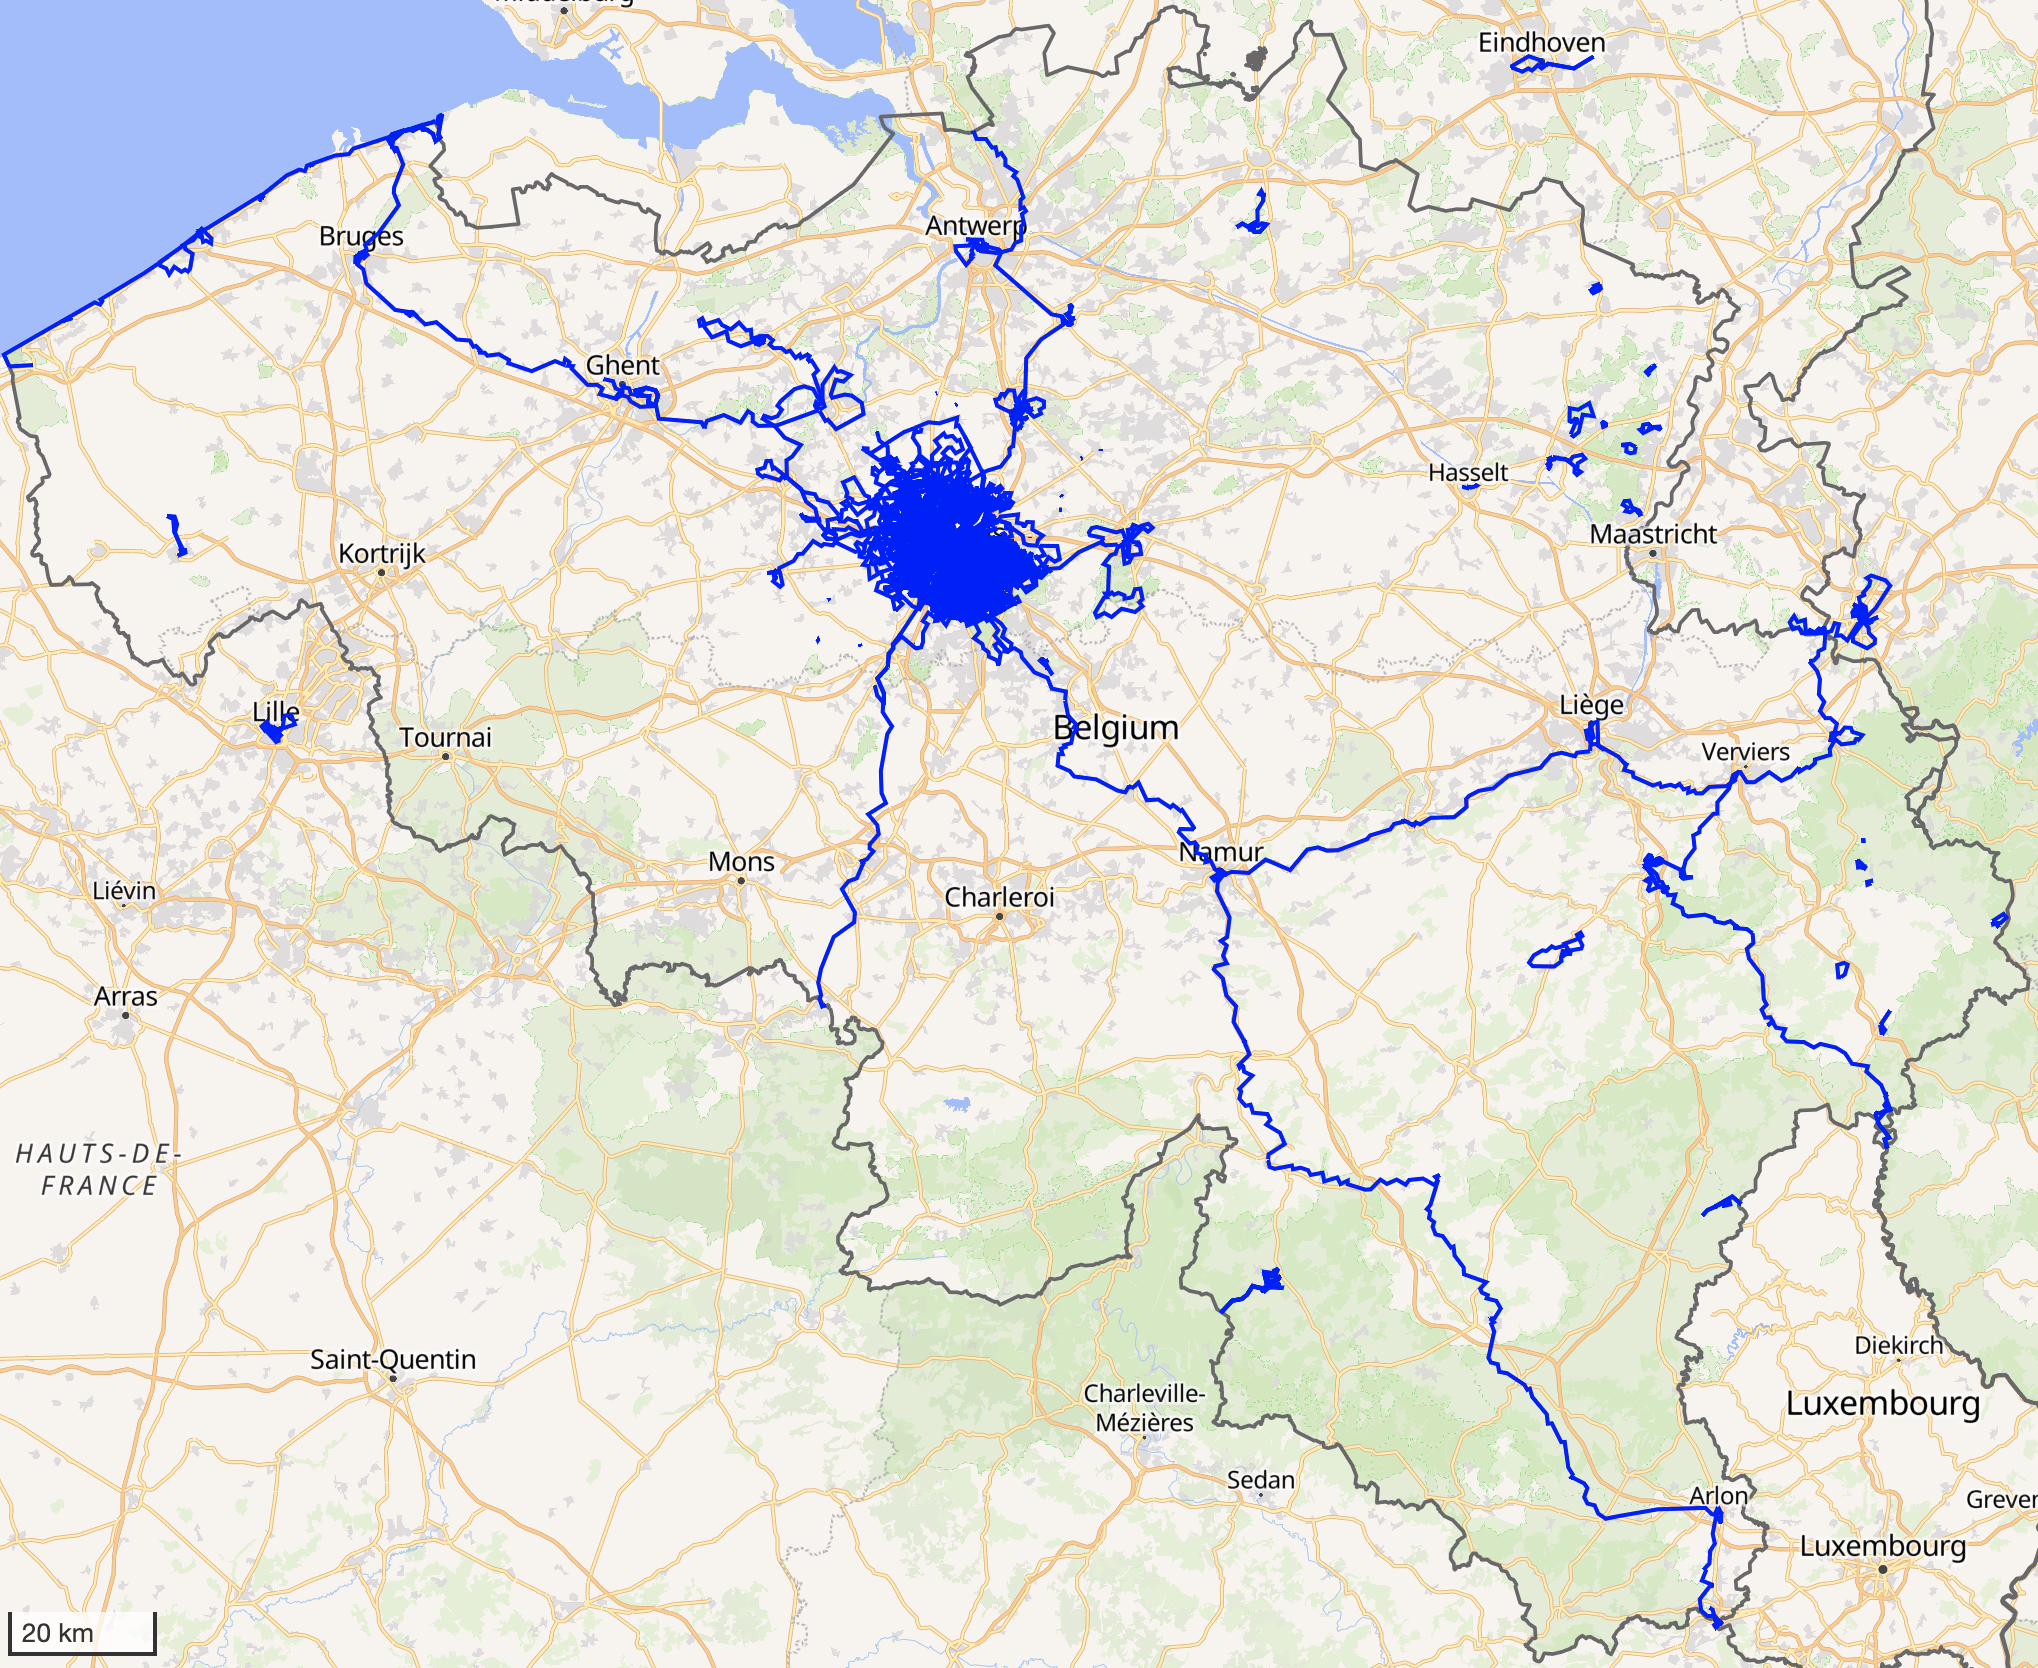
I can look at that map and recall several fun moments, beautiful sights, or memorable suffering. I would not mind thinking up more of these silly ideas just for the memories they create. Doing these also made me more appreciative of just being in nature for good chunks of time.
My new location does not make these adventures as easy (or at least, I have not quite found my same groove yet), though I have some ideas I am slowly working on. More on that if I hold on to this writing mood.